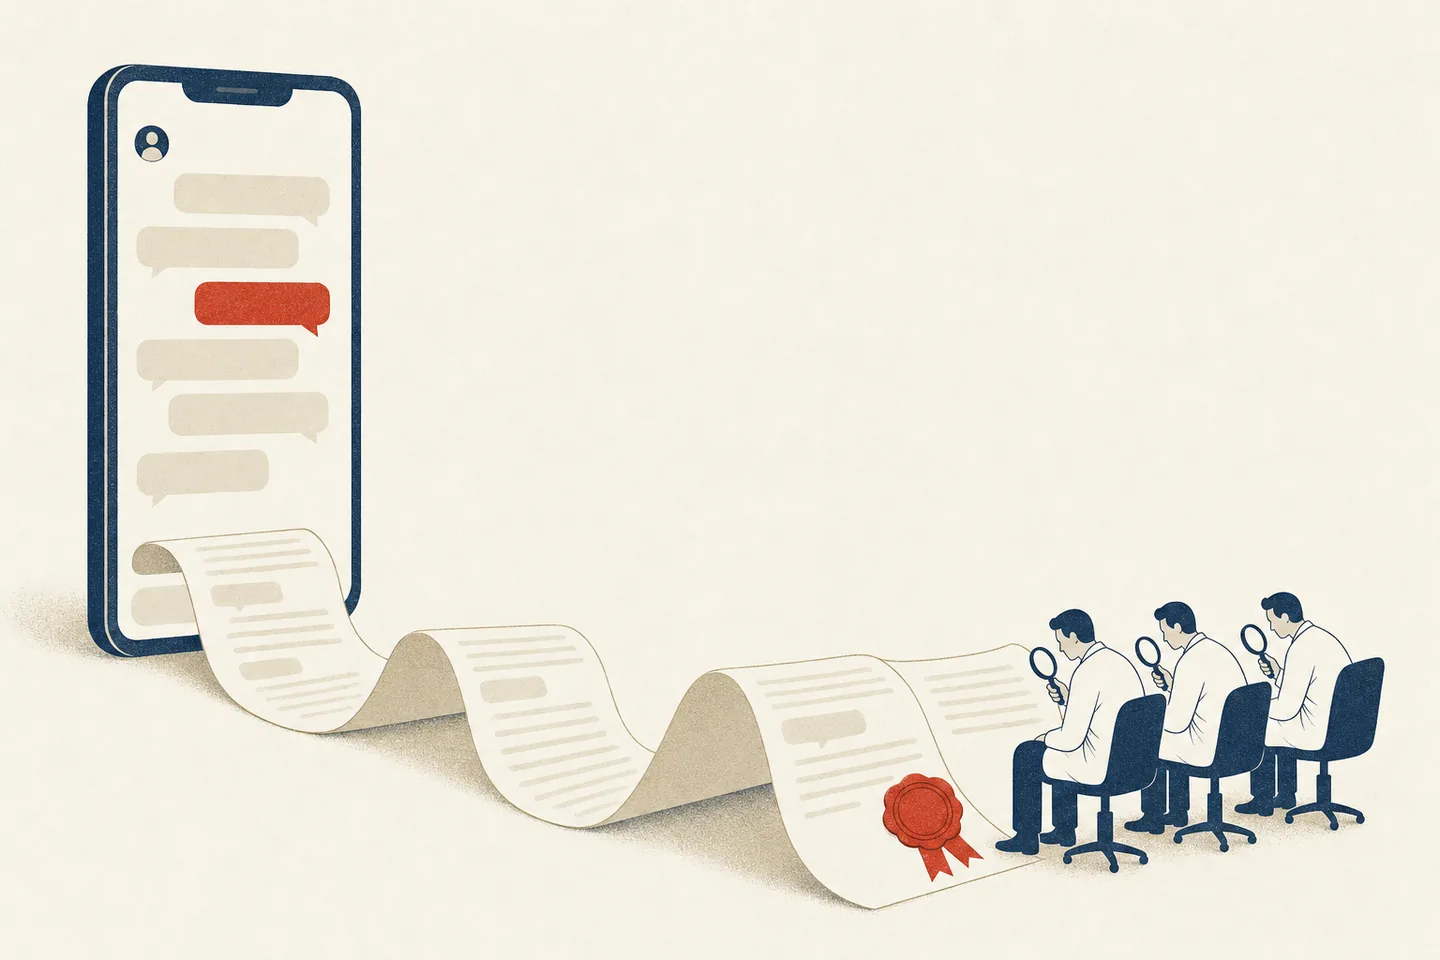
“More accurate” than clinicians: what Google’s SymptomAI was actually compared against
Google says clinical experts found SymptomAI’s differential diagnoses more accurate than clinicians’. On 517 real conversations they were — about 73% against about 62%, and the statistics hold. But the comparator physicians only ever read a chat transcript SymptomAI itself had produced — and across the study’s five arms their own score ranges about 34 points, a spread larger than the 11-point gap being claimed, and one the paper never tests.
On 22 July 2026, Google Research published a study of a symptom-checking AI called SymptomAI, deployed inside the Fitbit app to 13,917 people describing real symptoms. Under the heading “Clinical experts found SymptomAI DDx to be more accurate,” it reports: “We found that the clinicians ranked the DDx generated by SymptomAI to be accurate more often than the DDx provided by other clinicians.” The framing above the fold: a comparison of “SymptomAI’s diagnostic performance relative to real clinicians’ medical assessments.”
The result is real, and better grounded than almost anything in this genre. Not vignettes, not NEJM puzzles — real people describing real symptoms in their own words. On the 517 conversations three board-certified family physicians graded by hand, SymptomAI’s five-item differential contained the diagnosis those participants later reported receiving from a provider about 73% of the time, against about 62% for the physicians. Those two figures the paper plots but never prints; we measured them from Figure 2b. What it does print, we recomputed, and it holds.
The physicians never met a patient.
They read a chat transcript SymptomAI itself had produced — it asked the questions, decided when to stop, and wrote the record. No interview, no examination, no labs, no records, no second question. Question 1 of the instrument barred them from “any other electronic tools (e.g., Gemini, ChatGPT, Google Search)” — the category of thing they were measured against. The paper says so in its Limitations, Google’s blog repeats the caveat, and then the paper appraises the cost: “we believe the effects are subtle.”
Four panels earlier, Figure 2c shows the same three physicians scoring about 34% on transcripts from one SymptomAI arm and about 68% on transcripts from another — a range about three times the size of the 11-point gap the headline rests on. That between-arm spread is our own reading of the figure; the paper prints no per-arm numbers, never tests whether the variation is real, and never comments on it. A control condition is normally independent of the treatment. This one is built from the treatment’s own output.
The claim, and the sentence Google’s blog deleted
The paper is “SymptomAI: Toward a Conversational AI Agent for Everyday Symptom Assessment” (arXiv:2605.04012v2), from Google Research and DeepMind — 55 pages, 38 of them appendix. Its abstract carries a qualifier that does a great deal of work: SymptomAI’s differentials were “significantly more accurate (OR = 2.56, p < 0.001) than those from independent clinicians given the same dialogue in a blinded randomized comparison.” Eleven pages later its own Conclusion drops it:
“We demonstrate SymptomAI’s end-to-end real-world performance is superior to board certified clinicians through DDx accuracy on a population sample.”
Google’s blog closes on that same sentence — six words removed, and the paper’s closing sentence, three sentences further on, spliced to the end of it:
“We demonstrate SymptomAI’s end-to-end real-world performance through DDx accuracy on a population sample, and show how SymptomAI diagnoses can enable analysis of population-scale signals…”
We cannot see who made that edit or why, and do not guess. But the direction is the reverse of the usual one — the public summary is weaker than the paper — and that is the single biggest reason we rate this claim Needs context rather than something harsher. One word in the deleted clause is worth keeping: end-to-end is exactly what the clinicians never did. They ran the second half only, on a record the first half produced.
From 40,000 enrolled users to OR = 2.56 — how the comparison was run, step by step
Source: arXiv:2605.04012v2 §2.1, §2.3, §2.5, §A.2, §A.4, Tables 1–3 and Figure 2; Google Research blog (22 July 2026). Every number in this diagram also appears in a chart on this page with full sourcing and caveats. arxiv.org/abs/2605.04012
Data table
Stage
What happens
Note
40,000 US Fitbit users enrolled
Fitbit Labs study, June 2025 – 17 April 2026 · randomized across five interview styles (Base, Fixed/Flexible Canonical, Dynamic Live/Final), all Gemini 2.0 Flash
13,917 complete at least one SymptomAI conversation
the AI conducts the intake chat and writes the transcript; in every arm but Base it is prompted to end with its own five-item differential (DDx)
Ground truth: the participant's own provider diagnosis
self-reported at the end of the conversation, or at a two-week follow-up prompt — “a second or third hand report,” in the paper's words
(auto-rater set) Auto-rater set — all 1,228 linked cases
every conversation linked to a provider diagnosis · scored by a Gemini 2.5 Pro auto-rater · top-5 72.64% · top-1 43.16%
(clinical-evaluation subset) Clinical evaluation — 517 of the 1,228
two of three board-certified family physicians read the AI's transcript and each write a five-item DDx; the held-out third rates all three lists (two clinician, one SymptomAI) · round-robin: no one rates a list they wrote
Grading: a ranking task, then an accuracy score
raters pick the best list — SymptomAI's is chosen in 53.3% of cases against a 33.3% chance baseline — and score each list's top-5 accuracy
Headline: “more accurate than clinicians” — OR = 2.56
our reading of Figure 2b: SymptomAI 72.7% vs clinicians 62.0% top-5 — a 10.7-point gap
Read before citing
This diagram introduces no new numbers: every figure on it is either printed in the paper or is our pixel-calibration reading of Figure 2b/2c, exactly as documented in the corresponding chart's “Read before citing” block on this page.
The approximate values (34%, 68%, 72.7%, 62.0%) are our own measurements of the paper's figures; the paper prints no absolute accuracy for the head-to-head comparison anywhere in its text.
Ten days on, no mainstream outlet has touched this. We found nothing in the general press, nothing in the health trades, nothing in the technology press. What exists is an aggregator wave. Tech Times ran “Google AI Outdiagnoses Doctors in Study of Nearly 14,000 Real Patients” — both moves in one headline, the comparison welded to 14,000 rather than the 517 it was run on. Lumien shows the split inside one article: its headline says “Outperforms Clinicians in 13,917-Person Diagnosis Study,” its body that “a real doctor in a room with a patient picks up on things that do not make it into a typed chat log.”
Two people got it right, and both deserve naming. Remio reported the 517-case subset, both odds ratios, and that clinicians “reviewed the existing SymptomAI conversation transcript.” And the emergency physician Ryan Radecki got there first — writing in Evidence Triage on 9 May, ten weeks before Google’s blog post existed, working from the preprint alone. He named the 517 cases, flagged that validity “hinges on the self-reported diagnoses of a subset of participants, subject to a spectrum of reporting biases,” and put the central problem in one line: “The clinicians are hamstrung by making their diagnoses off a transcript and line of inquiry divergent from their own approach.” His verdict — “The part where SymptomAI ‘outperforms’ clinicians is a little more precarious” — was available to anyone who read the paper in May. We are late to it, not first.
13,917 people, 517 graded cases — and a reality gap the paper published on itself
From June 2025 to 17 April 2026, Google recruited US Fitbit users into Fitbit Labs and randomized them across five SymptomAI agents, all Gemini 2.0 Flash, differing only in how each was told to interview. Participants could report a provider diagnosis at the end of the conversation; those who had not yet seen a provider were prompted again two weeks later. That self-reported diagnosis is the ground truth — and the paper is candid that it is “a second or third hand report” and that some labels “may not be ’accurate’.” The funnel is steeper than the headline suggests: 40,000 enrolled, 13,917 completed a conversation, 1,228 linked to a provider diagnosis, 517 reached clinical evaluation. Google’s blog says “We enrolled 13,917 consenting research study participants,” and prints neither 1,228 nor 517.
Google's blog attaches the comparison to 13,917 people. It was run on 517.
Source: arXiv:2605.04012v2, §A.2 (“We enrolled a cohort of N=40,000 Fitbit users. Of these conversations, 13,917 participants completed at least one conversation and 1,228 were linked to a patient-reported diagnosis”), §A.4 (“this resulted in 517 eligible conversation and diagnosis pairs”), and Table 1. arxiv.org/abs/2605.04012
Data table
Item
Participants remaining at each stage of the study
Note
Fitbit users enrolled
40000
“We enrolled a cohort of N=40,000 Fitbit users”
Completed a conversation
13917
34.8% of those enrolled — the number the blog leads with
Reported a provider diagnosis
1228
8.8% of conversations — the auto-rated accuracy set
Clinically evaluated head-to-head
517
3.7% of conversations, 1.3% of enrolment — the AI-vs-clinician set
Read before citing
Every count here is printed in the paper's text; the percentages are our arithmetic on those counts.
Google's blog states “We enrolled 13,917 consenting research study participants.” The paper says 40,000 were enrolled and 13,917 completed at least one conversation. The blog does not mention 40,000, 1,228 or 517.
The 517 are not a random sample. §2.5 calls the clinical-evaluation cohort “randomly sampled”; the appendix says it was every eligible conversation available when the evaluation began, with 1,228 meeting the same condition by the end of deployment. It is a time-truncated cohort, and eligibility required a conversation that ended in a SymptomAI differential.
The paper tests the 517 for representativeness rather than asserting it, and the tests are reassuring: age D = 0.060, gender V = 0.058, weight D = 0.026, and a multivariate stress test predicting who self-reported a diagnosis reached only AUC = 0.591.
The best thing in the paper is a table almost nobody will read. Table 2 sets SymptomAI beside the benchmarks this field normally reports — 91.5% on symptom-checker vignettes, 81.6% on curated NEJM cases, 77.7% on this study’s survey panel, 72.6% on its naturalistic conversations. Publishing that staircase on yourself is rarer than it should be. The Discussion explains the descent, citing Bean et al.: top-3 accuracy falls “from 94.9% when AI processed vignettes directly to 34.5% when a layperson relayed the operative information from the vignette to the AI conversationally.”
91.5% on vignettes, 72.6% on real people — the same pipeline, four different test sets
Source: arXiv:2605.04012v2, Table 2 (performance of AI-generated DDx on curated case reports and symptom-checker vignettes alongside this study's data), §B.1. arxiv.org/abs/2605.04012
Data table
Item
Top-5 accuracy (%) · benchmark difficulty rising from top to bottom
Note
Symptom-checker vignettes (N = 50)
91.5
structured · 78 (±29) words per case
NEJM case reports (N = 301)
81.6
highly curated · 1,043 (±297) words per case
This study's survey panel (N = 1,509)
77.7
survey responses · 422 (±72) words per case
This study's conversations (N = 1,228)
72.6
naturalistic · 748 (±538) words per case
Read before citing
All four values and all four word counts are printed in the paper's Table 2. This is the paper at its best: it exists to attack the vignette problem, and it runs the comparison on itself.
The top two rows are Gemini scored on existing curated benchmarks, not the deployed SymptomAI agent conducting an interview. Only the bottom two are this study's own populations, and those are auto-rater scored.
The paper's §2.5 states the bottom two rows the wrong way round, attributing 72.6% to the auxiliary panel and 77.7% to the study population. Table 2 and Table 3 both say the reverse, and the slip runs in the flattering direction — it credits the study cohort with 77.7% where the tables give 72.6%.
The survey panel was never shown an AI differential before reporting its diagnosis, and it scored higher than the conversational cohort, not lower — which argues against a large anchoring effect from participants having seen SymptomAI's list before their appointment. Anchoring is never named, measured or controlled anywhere in the paper's 55 pages.
About 73% against about 62% — and what OR = 2.56 actually means
Take the result at full strength, because not disputing the mathematics is what lets the measurement critique land. On the 517 cases the paper reports “McNemar’s Test: Median OR = 2.56, 95% CI Cohen’s g [0.18, 0.26], p < 0.001.” Separately, in a blinded ranking, raters picked SymptomAI’s list as best of three in 53.3% of cases — “a significant preference over chance (odds ratio of 2.34, one-sided binomial test against expected P = 0.33, n = 517, p < 0.001),” Cohen’s h = 0.42. The blog reports this as “over 50% of the cases” without noting that chance, among three lists, is 33.3%.
We recomputed everything the paper prints enough detail to check. Cohen’s h comes to 0.413 against the reported 0.42; the chance odds ratio to 2.317 against 2.34; and OR 2.56 implies a discordant-pair proportion of 0.719 — a Cohen’s g of 0.219, inside the quoted interval. The arithmetic holds. Its description is looser: the Results call the ranking test “one-sided,” the Methods call the same comparison an “exact two-sided binomial test.”
SymptomAI 72.7%, clinicians 62.0% — the real numbers behind “OR = 2.56”
Source: Breda, Sunshine, McDuff et al. (Google Research / Google DeepMind), “SymptomAI: Toward a Conversational AI Agent for Everyday Symptom Assessment,” arXiv:2605.04012v2 (10 May 2026), Figure 2b and §2.3; claim framing from Google Research, “SymptomAI: Towards a conversational AI agent for everyday symptom assessment” (22 July 2026). arxiv.org/abs/2605.04012
Data table
Item
Top-5 accuracy (%) on the 517 clinically evaluated cases
Note
SymptomAI DDx
72.7
five-item list produced by the same agent that ran the interview
Baseline clinician DDx
62
three board-certified family physicians reading a transcript SymptomAI wrote
Read before citing
Both bars are our own measurements of the paper's Figure 2b, read by pixel calibration against the panel's own axis. The paper states no absolute accuracy for this comparison anywhere in its text: §2.3 reports only “McNemar's Test: Median OR = 2.56, 95% CI Cohen's g [0.18, 0.26], p < 0.001,” and the abstract gives the odds ratio with no percentages at all. Read our figures to about ±0.5 point; a second independent reading of the clinician bar gave 61.9%.
What OR = 2.56 means in plain terms: among the cases where exactly one side got it right, the AI was the right one about 72% of the time. It does not mean the AI was 2.56 times better. The ordinary difference between the two bars is 10.7 points.
The 517 clinically evaluated cases are 3.7% of the 13,917 conversations and 1.3% of the 40,000 users enrolled. Google's blog post attaches the comparison to 13,917 and never prints 517.
The comparison is real and better grounded than the vignette benchmarks this field usually runs on: ground truth is a diagnosis participants reported receiving from their own provider, both sides produced exactly five diagnoses, and a round-robin design meant no clinician graded a list they had written. The companion ranking result — clinical raters picked SymptomAI's list as best in 53.3% of cases against a 33.3% chance baseline — was collected before the ground truth or the AI's identity was revealed, and is blind.
The accuracy scoring was not. The appendix instrument reveals which list is SymptomAI's at Q10 (heading: “SymptomAI DDx is revealed”) and asks the top-5 accuracy question at Q19, with the DDx 1/2/3 labels carried over unchanged — although the paper states four times, including in its abstract, that this comparison was blinded to the DDx author.
What OR = 2.56 does not mean is that the AI was 2.56 times better. McNemar’s test runs only on cases where the two sides disagreed — roughly a quarter of them. Translated: where exactly one of the AI and the physician was right, the AI was the right one about 72% of the time.
The comparator doctors never met a patient. They read a transcript SymptomAI wrote.
Here is what the human baseline physically consisted of. Three board-certified Family Medicine physicians were shown a transcript of somebody’s chat with SymptomAI, the AI’s differential cut out, and asked:
“Please provide a differential diagnosis (DDx) for this patient given the symptom description present in the conversation. List 5 candidate diagnoses… While providing the DDx, please only use the information in the conversation and do not use any other electronic tools (e.g., Gemini, ChatGPT, Google Search).”
They “did not engage in any direct interaction or clinical care with the study participants,” and the transcript was the AI’s own product: “The same underlying model was used to both conduct the symptom interview and produce inline DDx.” SymptomAI asked the questions, decided when to stop, and wrote the record — in two of the five arms from an investigator-written script, in the others of its own choosing. Then its list was redacted and three physicians were asked to diagnose from what was left. The paper names this squarely, and deserves credit for it:
“…the clinician provided DDx used for clinical validation is based on a conversation between a participant and the AI system and not a patient interview conducted by the clinician themselves. Clinicians may have sourced different information had they directed the symptom interview. As such, the performance of SymptomAI requires contextualization with this fact. While this limits a fully controlled end-to-end comparison … we believe the effects are subtle, particularly in light of the fact that SymptomAI outperforms clinicians in the subset of patient-model interactions deemed to be of high quality…”
Google’s blog carries the caveat too. The question is the last clause — how subtle is subtle? The paper’s own Figure 2c bears directly on that, and the paper does not connect the two.
Same three doctors, 34% or 68% — and the paper never tests why
Figure 2c breaks top-5 accuracy out by arm for both sides. The physicians’ series runs, worst to best: about 34% on Base-arm transcripts, about 56% from Dynamic Live, about 64% from Fixed Canonical, about 65% from Dynamic Final, about 68% from Flexible Canonical. Nothing about the physicians changed across those bars — same three people, same instrument, same instruction. What differed was the transcript they were handed and, since the arms were separate randomised groups, the participants behind it. The ordering is what you would expect if transcript quality drives the human score: the Base arm, not instructed to ask follow-ups, sits lowest; the arms running a history script sit highest.
The same three doctors score 34% or 68% across the five study arms
Source: arXiv:2605.04012v2, Figure 2c (page 6), read by pixel calibration; arm definitions from §2.1; cross-checks against §2.1's printed combined accuracies. arxiv.org/abs/2605.04012
Data table
Item
Top-5 accuracy (%) by study arm · clinician bar first in each pair
Note
Clinicians · Base arm
34
user-driven chat: the AI asked no follow-up questions
SymptomAI · Base arm
47
AI ahead by 13 points
Clinicians · Dynamic Live arm
56
AI chose its own follow-ups, showing interim differentials
SymptomAI · Dynamic Live arm
75
AI ahead by 19 points
Clinicians · Fixed Canonical arm
64
AI asked a fixed medical-school history script
SymptomAI · Fixed Canonical arm
75
AI ahead by 11 points
Clinicians · Dynamic Final arm
65
AI chose its own follow-ups, final differential only
SymptomAI · Dynamic Final arm
69
AI ahead by 4 points
Clinicians · Flexible Canonical arm
68
AI asked the history script, free to skip irrelevant questions
SymptomAI · Flexible Canonical arm
79
AI ahead by 11 points
Read before citing
The paper prints no per-arm numbers. Every value here is our own measurement of Figure 2c, read from the rendered PDF against the panel's own 0.0–1.0 axis and rounded to whole points. Three independent readings of the clinician bars agreed to within 0.4 point.
The calibration reproduces three numbers the paper does state in text, which is why we are willing to publish it: our SymptomAI readings for arms 2 and 3 average 77.0% against the paper's printed 77.51%; for arms 4 and 5 they average 72.0% against the printed 72.07%; and our arms 2–5 mean minus Base is 27.5 points against the paper's printed 27.57%.
The clinicians were the same three board-certified family physicians throughout, doing the same task. What differed between arms was the transcript they were handed — and the participants behind it, since arms were separate randomised groups. Their measured accuracy still ranges about 34 points across arms, larger than the 10.7-point gap the headline rests on, though the paper reports no test of that between-arm difference. The paper's Limitations section says of this confound: “we believe the effects are subtle.”
Be fair to the paper: better interviews lift both sides, and SymptomAI's edge does not vanish in any arm. But it is not stable either — it ranges from 4 points (Dynamic Final) to 19 points (Dynamic Live) with no consistent pattern, and the paper never statistically tests the AI-vs-clinician gap at the arm level. The significance brackets in Figure 2c compare each arm against Base within a single source, not the two sources against each other.
Per-arm sample sizes are not printed anywhere. The 517 evaluated cases are split across five arms — a mean of 103 per arm — but the actual per-arm denominators are unpublished, so no bar's precision can be established. Figure 2c's error bars are standard errors of the mean.
The Base arm is not quite the same product as the other four. The paper notes that “the base condition (study arm 1) did not include specialized prompting to produce a DDx at the end of the conversation,” and for its cross-model figure it generated one post-hoc from the transcript. Case selection for the clinical evaluation prioritised conversations that ended in a SymptomAI differential, which would favour the Base conversations that happened to produce a list.
We offer that as an observation, not a measurement, because the paper does not support more. It publishes no per-arm values, no denominators, no confidence intervals, and no test of clinician performance against arm. A gap between the best and worst of five small subsets is a fragile statistic, and the 517 were filtered before grading — which we come to below. What can fairly be said: the claimed gap is about 11 points, the spread across the control condition is about 34, and whether that spread is real is not something the paper lets anyone determine. The values are ours, since the paper prints none; as a cross-check, it states eliciting arms averaged 27.57 points above Base, and weighting the two printed group figures equally gives (77.51 + 72.07) ÷ 2 − 27.57 = 47.22% against our reading of that bar at 47.2%. The paper does not specify that weighting, so this is a consistency check, not a recovery from text.
Two readings are available. The one that does not survive: that the AI’s advantage is merely an artefact of information the clinicians were denied — it isn’t, since both series rise together and SymptomAI leads in all five arms. The one that does: the human baseline here is not a stable property of the humans. It moves with the transcript, and the transcript is the AI’s work. That is enough to say the comparison measures differential-writing given a dialogue — what the abstract carefully claims — and not the end-to-end clinical task the blog’s framing invites readers to imagine.
Our field guide asked seven questions of an “AI beats doctors” claim; this study argued for an eighth, which we have now added: who ran the interview? With Microsoft’s MAI-DxO, the humans took a different test. Here they took a test the AI wrote.
In fairness: the AI leads in every arm, and where the doctors were confident it was a tie
The strongest case against our reading deserves stating at full strength. SymptomAI’s margin vanishes nowhere: arm by arm it runs about 13 points at Base, 11 at each Canonical arm, 19 at Dynamic Live and 4 at Dynamic Final. And the paper reports where its advantage concentrates:
“While clinicians and SymptomAI performed similarly well on conversations where the clinicians felt confident in their own DDx, SymptomAI significantly outperformed the clinicians for the conversations where the clinicians felt neutral or not confident in their own DDx.”
Google’s blog presents that as a strength — the edge “was greatest for cases where the clinician’s felt least confident in their own DDx.” Fair as description, and read the other way it is the honest boundary of the claim: where the physicians felt they had enough to work with, the two performed similarly. The paper’s own defence is that SymptomAI still wins on the highest-quality conversations, those containing “the requisite information to make a diagnosis.” That has real force. Where it stops working: conversation quality is itself a property of the interview the AI conducted, rated by a clinician reading the transcript the AI wrote. Restricting to the AI’s best work narrows the confound; it does not remove it. One absence, stated flatly: the paper reports no arm-level significance test of AI against clinician anywhere.
The ranking was blind. The accuracy score came after the reveal.
The paper describes its comparison as blinded in four places, including the abstract and Section 2.3: “the clinical raters reviewed the DDx alongside the ground truth diagnosis, while blinded to the DDx author.” The appendix publishes the instrument, and its headings give the order: “Task 2 Blind Ranking Questions (Ground truth self-reported Dx not yet provided)” for Q7–Q9; then “After the ranking subtask was complete, the DDx generated by SymptomAI was revealed”; then “SymptomAI DDx Evaluation (SymptomAI DDx is revealed)” from Q10; then the accuracy section leading to Q19. So the 53.3% ranking is blind. Q19 — which produces every clinician-scored accuracy number — comes after the reveal, under the same DDx 1/2/3 labels used at Q7.
We impute nothing about what raters did with that knowledge; the factual position is that the ranking is protected by design and the accuracy comparison by rater discipline, with no manipulation check to tell them apart. Credit in the same breath: all three lists were “reformatted into a standardized format … and any description of supplemental text removed” and randomly positioned, reducing stylistic cues; both sides produced exactly five diagnoses; and a held-out round-robin meant no physician ranked their own work.
43.16%, and a harm rate published only as a chart
The first guess. Across all 1,228 participants with a reported diagnosis, SymptomAI’s top-1 accuracy is 43.16%, against 72.64% for top-5. A clinician commits to a working diagnosis; a five-item list is not a diagnosis. Google’s blog prints no accuracy figure at all; the only performance number in its prose is “over 50%,” which refers to the ranking. Its own wearable-biosignal analysis is built on that top-1 label.
The first guess is right 43.16% of the time — a number the blog never prints
Source: arXiv:2605.04012v2, Table 3 (“Auto-Rater Accuracy by Illness Category”), SymptomAI Study totals. arxiv.org/abs/2605.04012
Data table
Item
Accuracy (%) against the participant's self-reported provider diagnosis · N = 1,228
Note
Top-1: the AI's leading diagnosis
43.16
the equivalent of committing to a working diagnosis
Top-5: anywhere in the five-item list
72.64
the basis of every accuracy claim in the paper and the blog
Read before citing
Both figures are printed in the paper's Table 3 on page 41. Google's blog contains no accuracy figure at all — the only performance number in its prose is “over 50%,” which refers to the ranking result, not to accuracy.
These are auto-rater scores, not clinician scores: Gemini 2.5 Pro judging output from Gemini 2.0 Flash. The paper reports the auto-rater agrees with clinicians at AUC = 0.866 and F1 = 0.918, and concedes the direction of its errors — “the majority of misalignments stem from auto-raters identifying a match in cases where clinicians were more conservative, which matches known sycophantic behavior.” The paper reports that error direction qualitatively; it does not quantify a net bias, so 43.16% should be read as the auto-rater's figure rather than a floor.
The auxiliary general-population panel scores 48.77% top-1 and 77.73% top-5 on N = 1,509.
No clinician top-1 comparator is reported anywhere in the clinician-rated evaluation. The head-to-head is a top-5 comparison only, even though the raters recorded the exact position (1–5) of the true diagnosis.
Top-5 is the right metric for a differential and the paper is explicit about using it, with both sides held to exactly five items. It is the wrong metric for a reader who takes more-accurate-than-clinicians to mean the machine names their illness.
Harm — measured, reported, undiscussed. Credit first: the study ran a real safety instrument, which many do not. Q21 asked what harm a rater would expect if the user acted on the interaction, Q22 how likely it was, Q23 for an overall rating from Innocuous to Severely harmful. The answer is published, in Figure 12g, where the flagged rate sits at roughly 2% to 5% by arm — our measurement off an unlabelled chart, so an order of magnitude rather than a rate. What is missing is not the result but any discussion of it: no harm figure appears in the running text of either document, and since Q21–Q23 were asked only about SymptomAI there is no clinician comparator to judge it against. We are not going to tell you a few percent is alarming, or that it is fine. For a symptom checker — even an investigational one, and Google is explicit that SymptomAI “is a research prototype and is not for diagnostic use” — it is a number worth deciding about — and the one that would most benefit from the authors simply printing it, with severity broken out.
Two things the paper says about itself do not survive its own appendix. The first is arithmetic: Section 2.5 states the generalization figures backwards against Tables 2 and 3, crediting the headline cohort with 77.7% where the tables give it 72.6%. The second matters more. Section 2.5 says the clinical-evaluation sample “was randomly sampled from the subset of the study population which had self-reported a diagnosis.” The appendix describes a four-stage screen: conversations had to end in a SymptomAI differential, clear a ten-word minimum, and then — the step worth pausing on — “a naive baseline Gemini prompt” sorted them into those “capable of producing a plausible best-effort DDx” and those “impossible to make medical assessments using conversation data,” discarding the latter. A fourth prompt screened the reported diagnoses. What survived was 517. So a Gemini prompt decided which conversations were good enough to be diagnosed from, before three physicians were scored on diagnosing from them. Which way that cuts is unknown — the paper reports no analysis of what was filtered — but it is not a random sample, and it was screened on precisely the variable this article is about.
The finding that appears third, without a number: asking questions is worth 28 points
The most useful result here is not the one in the headline, and unlike the clinician comparison it has a clean control. The pre-stated hypothesis was about prompting: “We hypothesized that at least one of the agents with specific system prompts designed to elicit follow up questions would demonstrate a statistically significant improvement in top-5 accuracy…” Participants were randomized across the five arms. It worked. Agents that actively elicited information scored “an average of 27.57% higher accuracy than the base user-guided prompting strategy.” Every arm beat Base individually (p = 0.003, p < 0.001, p = 0.003, p = 0.022), and letting the agent choose its own follow-ups was not significantly different from a medical-school history script (p = 0.235). To be clear about units, since the paper writes it with a percent sign: 27.57 is percentage points, from about 47% to about 75%.
The result Google's post reports third, without a number: asking questions is worth 27.57 points
Source: arXiv:2605.04012v2, §2.1 (combined arm accuracies and the 27.57% average gap) and Figure 2c (Base arm value, read by pixel calibration); pre-stated hypothesis at §A.1. arxiv.org/abs/2605.04012
Data table
Item
SymptomAI top-5 accuracy (%) by prompting strategy
Note
Base — user-driven chat
47
no follow-up questions — how every consumer chatbot behaves by default
Dynamic arms (4 & 5)
72.07
AI picks its own follow-up questions · printed in §2.1 as a combined figure
Canonical arms (2 & 3)
77.51
AI asks a medical-school history script · printed in §2.1 as a combined figure
Read before citing
The two combined figures are printed in the paper's §2.1, as is the headline: a model-guided interview “resulted in an average of 27.57% higher accuracy than the base user-guided prompting strategy.” The Base arm's own accuracy is not printed anywhere; the 47% bar is our measurement of Figure 2c, and 74.5% minus 47% reproduces the paper's stated 27.57-point gap to within half a point.
This is the best-supported finding in the paper, and it was the study's pre-stated hypothesis. It is properly randomized, and each arm individually beat Base (arm 2 p = 0.003, arm 3 p < 0.001, arm 4 p = 0.003, arm 5 p = 0.022). It requires no comparison to a human at all.
Letting the AI choose its own questions was not significantly different from making it follow the clinician-written script (χ², p = 0.235) — a result about interview design that stands on its own.
The Base arm was not prompted to produce a differential at the end of the conversation, so it is not measuring the same product surface as the other four arms. That handicap is disclosed, but it means the 27.57-point gap is partly a prompting artefact and not purely a measure of information elicited.
Google's blog does report this result, under the heading “Eliciting more information improves performance,” but without a single number and below the clinician comparison.
Why it matters: “at present, all major consumer facing LLMs use this user-guided approach which does not ‘force’ eliciting more information from users about symptoms before providing a differential diagnosis.” The Base arm was built to approximate that default — “the typical user-driven LM chat experiment that a person would have if they visited Gemini without special prompting” — and scored about 47%. One caveat we owe it: Base “did not include specialized prompting to produce a DDx at the end of the conversation,” so some of the gap may be output formatting. Google’s blog does report this finding, third, and without a number.
What would move this rating
An end-to-end comparison. Let the physicians conduct their own interviews with a matched sample. If SymptomAI still leads, the claim survives its main objection and we would say so.
Per-arm numbers and an arm-level test. Publishing the Figure 2c values with denominators would replace our measurements with the authors’ own, and a test of AI against clinician within arms would settle how stable the margin is.
The harm distribution, in numbers — with severity broken out and a clinician comparator, so readers can judge the safety question rather than read it off a bar chart.
What the four-stage filter removed, and whether it mattered.
The bottom line
Believe this: a Gemini-powered agent, interviewing real people about real symptoms in a shipping app, produced five-item differentials that contained the diagnosis those people later reported receiving from a provider about 73% of the time — on a naturalistic distribution of illness, not a curated benchmark. Believe also that, in this study, making the chatbot ask questions before it answered was worth about 28 points: the most actionable number in the paper, and the one finding with a clean randomized control.
Don’t believe this: that it shows an AI is more accurate than a doctor. What the study supports is narrower, and the abstract says it plainly — given the same dialogue, SymptomAI’s differential was more often right than one written by a physician reading that dialogue. That is a real finding about writing a differential from a transcript. It is not a finding about diagnosis, because no clinician here was permitted to do the part of diagnosis that comes first. Nor should you read the 73% as a diagnosis: the first guess is right 43% of the time, and the other four entries are alternatives to be ruled out, not answers.
The deeper point is not about Google, who published the funnel, the instrument, the limitation and the reality gap, and whose blog post is measurably more restrained than their own paper’s conclusion. It is that this study finally fixed the problem everyone complains about — vignettes instead of patients — and in fixing it created a new one. To get thousands of undifferentiated real patients, something has to interview them at scale — and in this study, as in the ones like it, that something was the AI. Whenever it is, the human comparator cannot also be the interviewer. Those two problems trade against each other, and we have not yet seen a published design that resolves both.
Every few weeks: one big health-AI claim, traced to its primary source, with the part the headline left out put back in red. That’s the whole email — one-click unsubscribe, no tracking pixels.